Implementation of Multi-class Logistic Regression using TensorFlow library.
%matplotlib inline
import matplotlib
import matplotlib.pyplot as plt
import numpy as np
import tensorflow as tf
plt.rcParams['figure.figsize'] = (16, 8)
mnist = tf.keras.datasets.mnist
[X_train, Y_train],[X_test, Y_test] = mnist.load_data()
# one hot for multi-class classification
# MNIST = 10 classes [0-9]
y_train_oh = np.zeros((Y_train.size, 10))
y_train_oh[np.arange(Y_train.size), Y_train] = 1
y_test_oh = np.zeros((Y_test.size, 10))
y_test_oh[np.arange(Y_test.size), Y_test] = 1
print('X_train:', X_train.shape)
print('Y_train:', Y_train.shape)
print('y_train_oh:', y_train_oh.shape)
print('X_test:', X_test.shape)
print('Y_test:', Y_test.shape)
print('y_test_oh:', y_test_oh.shape)
X_train: (60000, 28, 28) Y_train: (60000,) y_train_oh: (60000, 10) X_test: (10000, 28, 28) Y_test: (10000,) y_test_oh: (10000, 10)
fig, AX = plt.subplots(3, 6, sharex=True, sharey=True)
np.random.seed(1234)
for ax in AX.ravel():
rindex = np.random.randint(Y_train.size)
ax.imshow(X_train[rindex])
# title label + one-hot
title = '{} :: '.format(Y_train[rindex])
title += ''.join([str(int(e)) for e in y_train_oh[rindex]])
ax.set_title(title)
plt.grid(False)
x_train, y_train = X_train/255, Y_train[np.newaxis].T
x_test, y_test = X_test/255, Y_test[np.newaxis].T
x_train = x_train.astype(np.float32)
y_train = y_train.astype(np.float32)
x_test = x_test.astype(np.float32)
y_test = y_test.astype(np.float32)
print('x_train:', x_train.shape)
print('y_train:', y_train.shape)
print('x_test:', x_test.shape)
print('y_test:', y_test.shape)
x_train: (60000, 28, 28) y_train: (60000, 1) x_test: (10000, 28, 28) y_test: (10000, 1)
# reshape Xs
x_train = x_train.reshape(-1, 28*28)
x_test = x_test.reshape(-1, 28*28)
print('x_train:', x_train.shape)
print('x_test:', x_test.shape)
x_train: (60000, 784) x_test: (10000, 784)
EPOCHS = 5000 # epochs
ALPHA = 0.005 # learning rate
BATCH = 100 # batch size
# m is the number of examples
# n_x is the input size 28x28=784
m, n_x = x_train.shape
X = tf.placeholder(tf.float32, shape=[None, n_x], name='X')
Y = tf.placeholder(tf.float32, shape=[None, 10], name='Y')
# variables initialization
W = tf.Variable(tf.zeros([n_x, 10]), tf.float32, name='W')
B = tf.Variable(tf.zeros([1, 10]), tf.float32, name='B')
init_variables = tf.global_variables_initializer()
# model
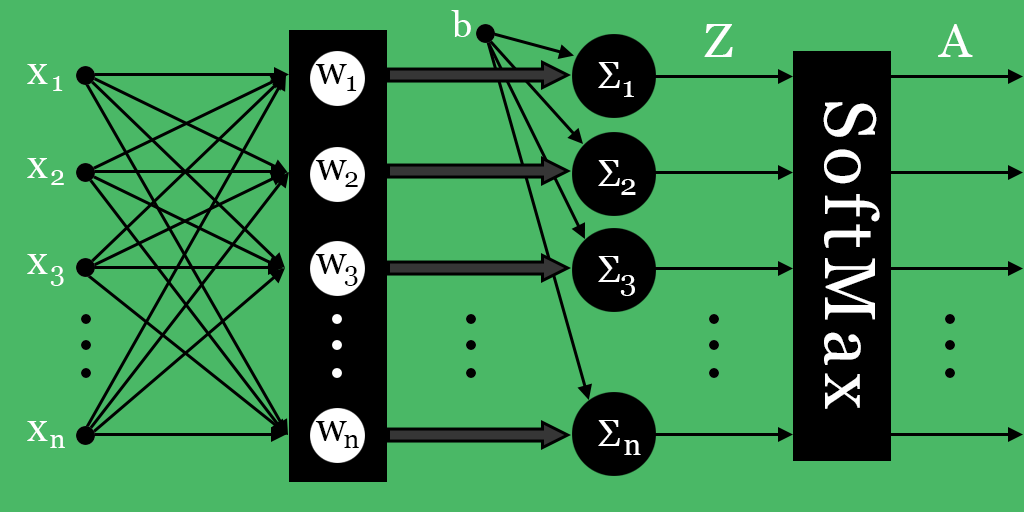
Z = tf.add(tf.matmul(X, W), B)
A = tf.nn.softmax(Z)
# training graph and optimization
loss = tf.reduce_mean(tf.nn.softmax_cross_entropy_with_logits_v2(logits=A, labels=Y))
optimizer = tf.train.GradientDescentOptimizer(learning_rate=ALPHA).minimize(loss)
accuracy = tf.reduce_mean(1 - tf.abs(Y - A))*100
# loss and accuracy storage
loss_plot = []; accA_plot = []
with tf.Session() as sess:
sess.run(init_variables)
for epoch in range(EPOCHS + 1):
# randomic batch definition
rbatch = np.random.choice(Y_train.size, size=BATCH)
# training, metrics and storage
sess.run(optimizer, feed_dict={X: x_train[rbatch], Y: y_train_oh[rbatch]})
L = sess.run(loss, feed_dict={X: x_train[rbatch], Y: y_train_oh[rbatch]})
acc = sess.run(accuracy, feed_dict={X: x_test, Y: y_test_oh})
loss_plot += [L]; accA_plot += [acc]
if (not epoch % 1000) and (epoch != 0):
print('epoch: {0:04d} | loss: {1:.3f} | accuracy: {2:06.2f} %'.format(epoch, L, acc))
W_ = sess.run(W) # store W and B for visualization and test
B_ = sess.run(B)
epoch: 1000 | loss: 2.207 | accuracy: 084.27 % epoch: 2000 | loss: 2.033 | accuracy: 087.67 % epoch: 3000 | loss: 1.917 | accuracy: 089.81 % epoch: 4000 | loss: 1.857 | accuracy: 091.22 % epoch: 5000 | loss: 1.852 | accuracy: 092.18 %
fig, AX = plt.subplots(1, 10, sharey=True)
for i in range(10):
AX[i].imshow(W_.T[i].reshape(28, 28))
AX[i].set_title(r'$W_{}$'.format(i))
fig, [axA, axB] = plt.subplots(2, 1, sharex=True)
axA.plot(loss_plot)
axA.set_ylabel('loss')
axB.plot(accA_plot)
axB.set_ylabel('accuracy')
plt.xlabel('epochs')
plt.show()
fig, AX = plt.subplots(3, 6, figsize=(2048//72, 1024//72))
AX = [b for a in AX for b in a]
np.random.seed(1)
for ax in AX:
index = np.random.randint(y_test.size)
Z_ = np.dot(W_.T, x_test[index]) + B_
Y_ = np.argmax(Z_)
if Y_ == y_test[index]:
ax.imshow(x_test[index].reshape(28, 28))
else:
ax.imshow(1 - x_test[index].reshape(28, 28))
ez = np.exp(Z_ - Z_.max())
A_ = ez/ez.sum(); A_ = float(A_.T[Y_])
ax.set_title(r'$\hat{Y_i}$ = ' + str(Y_) + ' ; $A_i$ = {:.03f}'.format(A_), fontsize=20)